

Salary Cap Research: How the Suns Spending Measures Against NBA Success
I check in on the struggling Suns ahead of the trade deadline, compare their spending with the best teams of the past decade, and attempt to answer if there are limits to a spending advantage.

The Phoenix Suns have gone 8-16 since their 8-1 start and sit two games out of the Play-In Tournament. Of course, their descent in the standings coincided with Durant’s calf injury. They are 1-9 with games without him. They also went 1-4 when Devin Booker missed five games recently.
But that hasn’t stopped the NBA world from taking notice. And the constant churn of injuries raises legitimate concerns.
The silver lining? They’re 13-3 in games where Durant and Booker both play. But health issues aside, they need to make a strong run now. Not just to get back into the playoff picture, but also to see if this team is a true championship contender. Otherwise, they’re on track to have one of the most inefficient spending seasons in NBA history.
The Phoenix Suns came into the 2024-25 season looking to finally meet the lofty expectations set when they acquired Kevin Durant. And it seemed like they were headed in that direction with an 8-1 start. The additions of Tyus Jones and Mike Budenholzer appear like they should help them through the regular season and put them in a better position to advance in the playoffs.
The acquisition of Durant meant the Suns would be a significant luxury taxpayer going forward. They couldn't field a competitive with two $50 million players without a willingness to spend. The acquisition of a third $50 million player in Bradley Beal meant that they were going to have a historically expensive team.
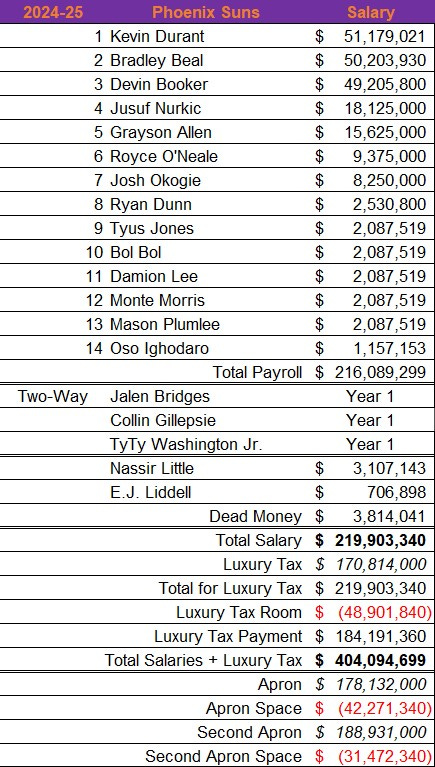
The Suns currently have a $219.9 million payroll and project with a $184.2 million luxury tax penalty. Their projected penalty would be the largest tax penalty in NBA history and $93 million more than the second-highest this season. The $404 million payroll and tax combination would also be the most expensive in history.
They are also deep above both apron levels. If there was a third apron, they’d be above it too.
I don’t expect the Suns to change directions if they continue to struggle. They will probably continue to look for ways to improve the roster but are extremely limited at this year’s trade deadline. They can’t increase payroll in a trade because they are an apron team, so any upgrade they make to the roster should also save them money. They are limited to trading just one first-round pick in 2031 and three second-round picks.
There could be pressure to reduce spending next month if they continue to tread around .500. I don’t think there is a team out there with an appetite to acquire Beal and the remaining two years, $111 remaining on his contract beyond this season. More realistically, perhaps they could reduce costs by trading Jusuf Nurkic, Grayson Allen, or Josh Okogie.
For example, getting off Okogie’s $8.25 million would save nearly $56.5 million against their payroll and tax. His contract structure was designed to give the Suns an extra salary for trade purposes. The Suns or whichever team acquires him can waive him next offseason without incurring a dead cap hit.
Another potential element of urgency to reduce payroll is their projected spending for next season. That’s because they will have an even more expensive roster due to entering the repeater tax1 and the implementation of higher tax rates2.
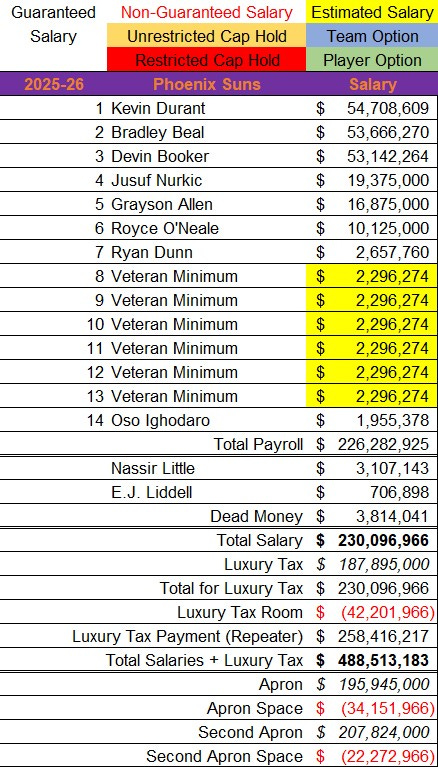
If all their players under contract for 2025-26 return except Okogie, they are still looking at a roster exceeding $488 million at a minimum once they fill out the rest of their rosters. That could suggest some significant payroll reduction may come. This would be the first time a team has a higher tax penalty than their total payroll.
The longer they remain out of the playoff picture, the more likely we’ll hear rumors of Durant or Booker to Houston trades in exchange for their first-round picks back3. But I still wouldn’t expect them to do a full teardown if they traded either player. The problem with the Rockets’ framework is that it doesn’t completely bail them out. They still couldn’t bottom out because the Wizards have their swapping rights in odd-numbered years through 20304.
The Suns should get back above .500 in January. They are set to face nine teams below .500 this month. They’ll have a couple of strong opponents, but they won’t truly be tested until February. They have a stretch of five games right after the trade deadline, including the Thunder, Nuggets, Grizzlies, and Rockets. Then their schedule cools down before another strong slate begins in March.
By then, we should know how they stack up against the rest of the ultra-competitive Western Conference.
This level of spending has me wondering how it compares to some of the highest spenders in history. But what is a fair expectation for one of the league’s highest spenders? And what is a good way to compare spending with teams that advanced far in the playoffs?
To answer that first question, I wouldn’t go as far as to say it’s championship or bust for the Suns. There is a good amount of luck that goes into any title run, such as good health. There are other uncontrollable factors like the strength of the opponent. Some teams get playoff paths with more favorable matchups than others.
I’ll use the conference finals as the criteria. It’s a reasonable bar for the team with the highest spending and the time sensitivity attached to spending at that level. This data might not necessarily tell us if a team should pay the tax to contend as the results are pretty split among taxpayers and non-taxpayers. But it could inform us how deep taxpayers should go into the tax — if at all — before there is no longer a spending advantage.
As for the second question, I needed to find a different way to compare one team’s spending to another between different seasons. While the raw numbers speak for themselves, the rising cap over the years makes spending relative.
So I measured total spending as a percentage of the luxury tax5. The idea is that the median non-taxpaying team aims to keep their payroll right below the luxury tax line. This makes it a defacto hard cap for a large portion of the league, so it makes sense to measure the rate a team spent above it.
For example, the Timberwolves are projected with the second-highest tax penalty for this season at $91 million. That, along with their $202.5 million payroll, puts their total spending 72 percent above the luxury tax line. In simpler terms, they’re spending roughly 1.72 times above the typical non-taxpaying team.
In comparison, the Nets had a $90 million tax penalty in 2013-2014. That was the highest penalty at that time and remained the highest until they topped it in 2021-22 with a $98 million penalty. Their $90 million penalty, along with their $103 million payroll ($193 million total spending), meant they spent 2.7 times above the tax line in 2013-14. Now $190-200 million is a general range for taxpaying teams who aren’t deep into the tax for this season.
So now that I know my criteria and what to measure, I looked back at every conference finalist since 2014 and pulled up their overall spending relative to the luxury tax. I didn’t want to go back earlier than 2013-14 because that was the first season in which increasing incremental tax rates were implemented6. I suppose you can call 2013-14 onward the modern luxury tax era7.
Here are the results:
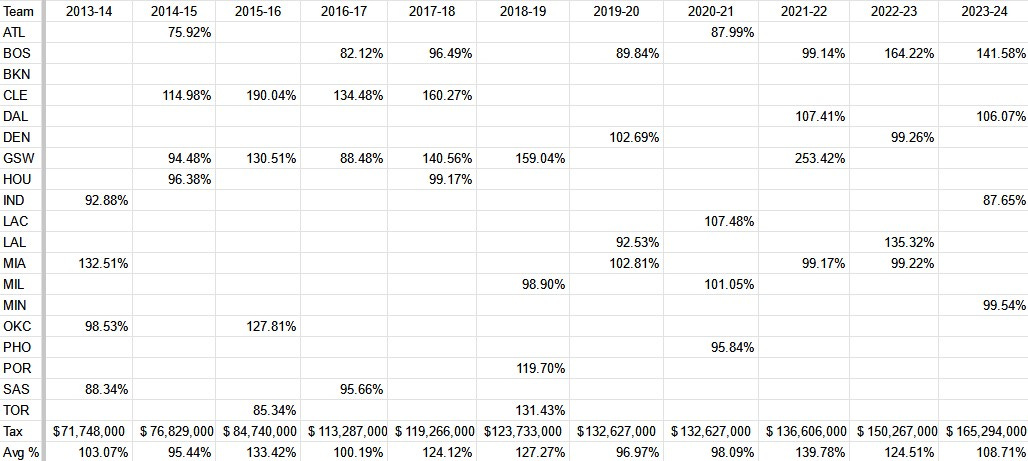
The 44 conference finalists spent an average of 1.38 times above the tax8. 23 of those teams spent at or below the tax line. The other 21 taxpayers spent an average of 1.36 times above the tax line. As an in-season example, the Los Angeles Lakers are currently on track to spend that rate above the tax line with their $185.4 million payroll and $41.4 million luxury tax penalty.
I think it’s safe to say there is a competitive advantage to spending, but not by too much. At some point, commonly around 30 percent above the tax line, there are diminishing returns to a team’s success relative to its spending.
The Suns’ $404 million spending this year is 2.36 times above the $170.8 million tax line. So historically, it isn’t the highest relative amount spent in a season. The Nets $193 million spent in 2013-2014 remains the highest total spent relative to an individual season’s tax rate (2.7x). They won in the first round that season, but I can’t imagine one playoff series victory being considered a successful season for the Suns.
That 2.36 multiplier is not even the second most. The 2021-22 Warriors spent 2.53 times above the tax line. Their tax penalty was just $5.5 million less than their total payroll that year. Fortunately for the Warriors, they got one title in their four consecutive seasons of record-breaking spending9.
So currently the all-time spenders in relation to the tax are:
2013-14 Brooklyn Nets: 2.7x (second-round exit, 5 playoff wins)
2021-22 Golden State Warriors: 2.5x (champions)
2024-25 Phoenix Suns: 2.36x (?)
2022-23 Golden State Warriors: 2.34x (second-round exit, 6 playoff wins)
2023-24 Golden State Warriors: 2.32x (missed playoffs)
The Suns could drop below these teams if they reduce payroll. But even if they offload Okogie like in my example, they’re still looking at being a 2x spender. So the Suns would still be looking at a historically inefficient spending season unless they start looking like contenders soon.
Teams in the luxury tax in three of the previous four seasons get designated as repeat taxpayers and pay higher rates.
Starting in 2025-26, tax rates beyond the third level are set to increase by $1 each. Also, repeater rates will increase from an additional $1 to $2 each.
The Nets acquired four unprotected first-round picks from the Suns in 2023, 2025, 2027, and 2029 for Kevin Durant. The Rockets recently acquired the 2025 and 2027 selections, and potentially the 2029.
The Wizards have the right to swap first-round picks with the Suns in 2026 and 2030 as part of the Bradley Beal trade. Brooklyn has the right to swap 2028 with the Suns, also from the Durant trade.
(Payroll + luxury tax penalty) / luxury tax amount.
Between 2014-2024, tax rates increased every $5 million a team went above the luxury tax line. Starting in 2024-25, those $5 million thresholds now increase each year by the percentage that the salary cap increases.
We might be entering a luxury tax era since tax rates are set to be modified next season. Time will tell how much they impact spending behavior.
That average would drop to 8 percent if you exclude the outlier 2021-22 Warriors.
The 2022-23 and 2023-24 Warriors spent roughly 2.3 times above the luxury tax line. So the top five all-time would go 2014 Nets, 2022 Warriors, 2025 Suns, 2023 Warriors, and 2024 Warriors, in that order.
Really enjoyed this analysis. Feel like the writing is on the wall for the eventual implosion of this roster given their defensive shortcomings. Do you know of any courses/resources to become more knowledgeable about the intricacies of the CBA?
Excellent article about my beloved Suns